The Arizona manufactured home market is often overlooked, but it’s proving to be one of the more balanced and opportunity-rich segments of real estate. Whether you’re a buyer, seller, or investor, understanding the latest trends across key cities can help you make smart decisions.
Below is a breakdown of market activity for May 2025 in several cities across Arizona.
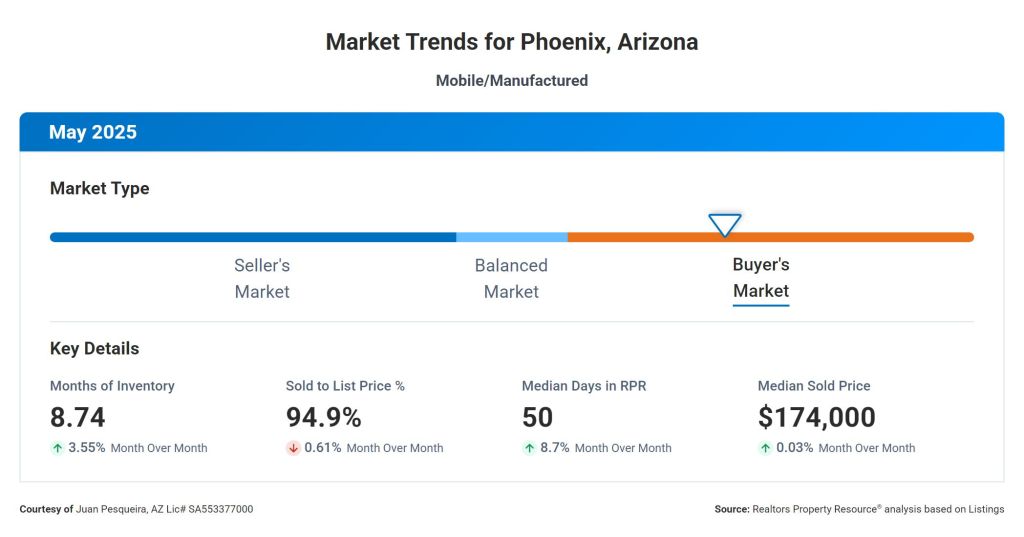
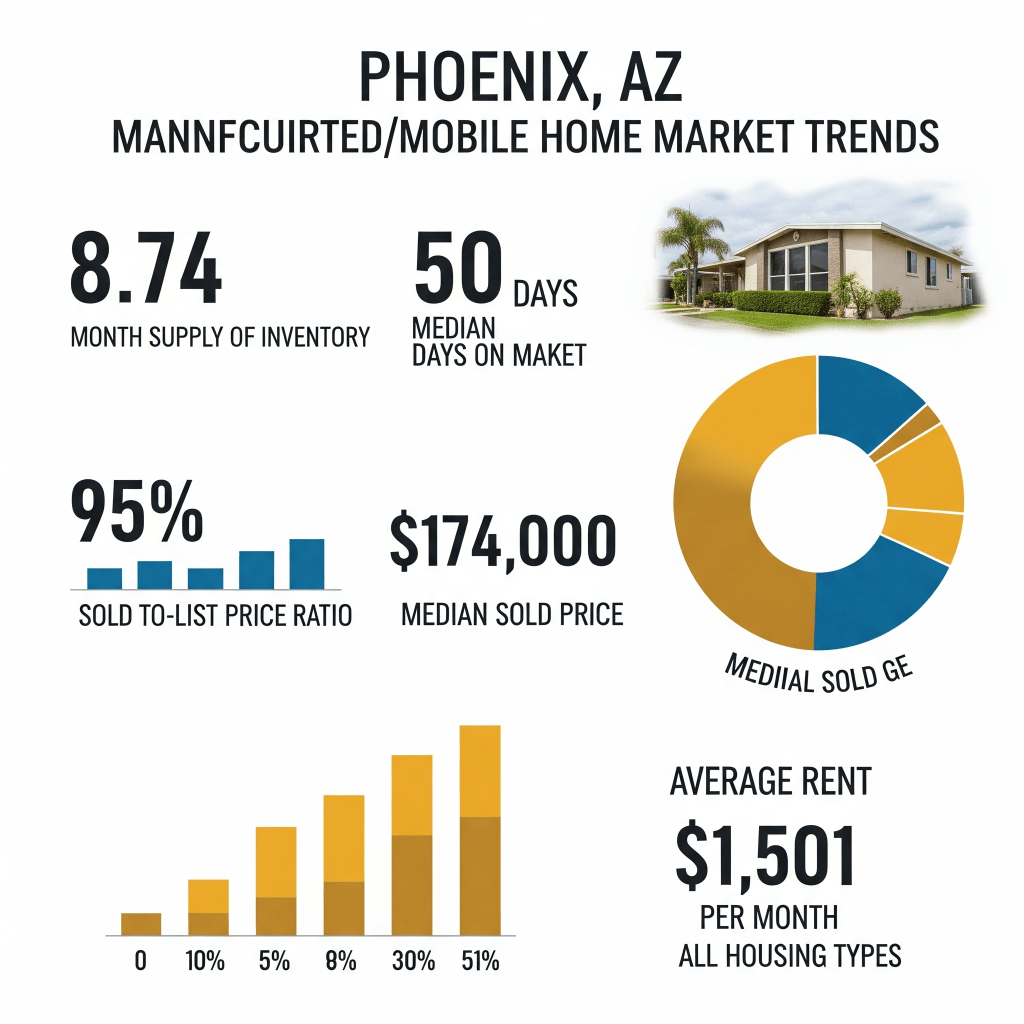
📍 Phoenix, AZ
- Months Supply of Inventory: 8.74
- Median Days on Market: 50 days
- Sold-to-List Price Ratio: 95%
- Median Sold Price: $174,000
- 💰 Avg. Rent (all housing): $1,501/month rentcafe.com+2rentcafe.com+2zumper.com+2
Investor Insight: A balanced market with healthy turnover. Rental demand at $1.5K/mo supports strong cash flow potential.
Summary: Phoenix shows signs of a balanced market. Inventory has slightly increased, giving buyers more options while sellers still receive solid offers close to asking price.

📍 Mesa, AZ
- Months Supply of Inventory: 8.68
- Median Days on Market: 80 days
- Sold-to-List Price Ratio: 94%
- Median Sold Price: $105,000
- 💰 Avg. Rent (all housing): $1,485/month
Investor insight: Moderately paced sales give investors room to negotiate. Rent levels make income projections attractive relative to lower entry prices.
Summary: A healthy balance between buyers and sellers. Homes are taking longer to sell, which may present negotiating opportunities for buyers.
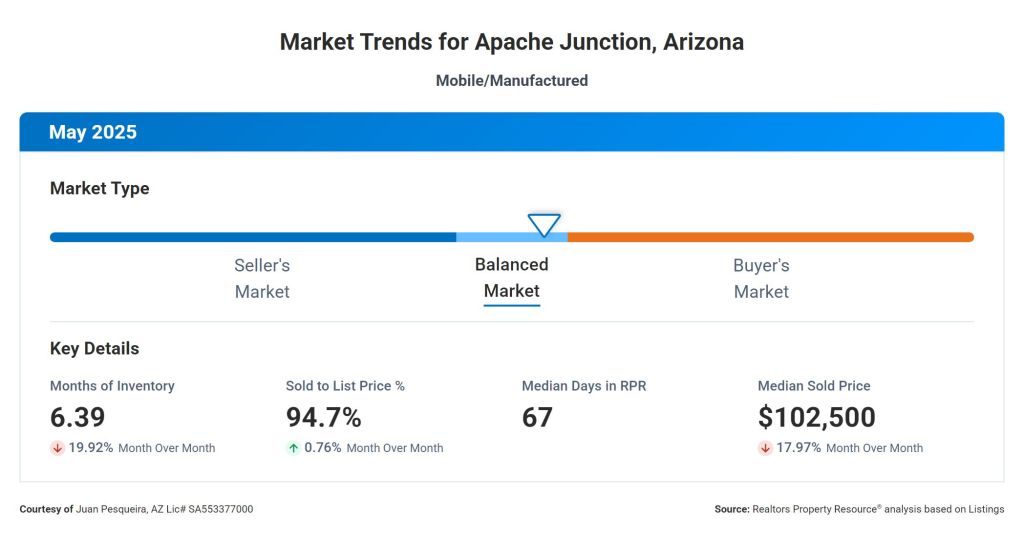
📍 Apache Junction, AZ
- Months Supply of Inventory: 6.39
- Median Days on Market: 67 days
- Sold-to-List Price Ratio: 95%
- Median Sold Price: $102,500
- 💰 Avg. Rent (all housing): $1,648/month
Investor insight: Tightest supply among cities—great for rental yield. Higher rent plus affordable acquisition cost = solid ROI.
Summary: One of the tighter markets with relatively low inventory. Homes are selling at stable prices and within a reasonable time.
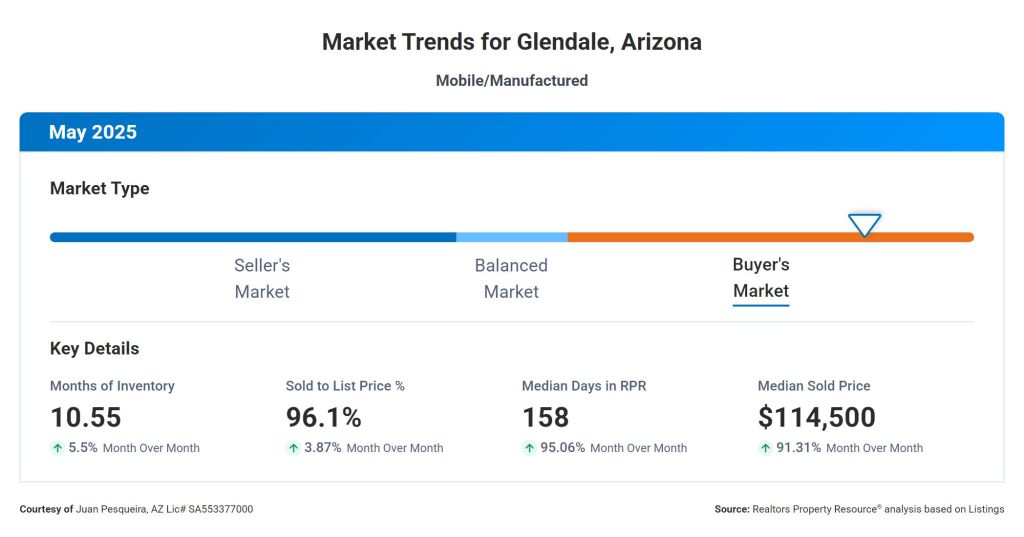
📍 Glendale, AZ
- Months Supply of Inventory: 10.55
- Median Days on Market: 158 days
- Sold-to-List Price Ratio: 96%
- Median Sold Price: $114,500
- 💰 Avg. Rent (all housing): $1,423/month realtor.com+11trulia.com+11zillow.com+11realtor.com+4rentcafe.com+4zumper.com+4
Summary: Higher inventory and longer time on market suggest opportunities for buyers. Pricing remains firm despite slower sales. Rental income still strong.
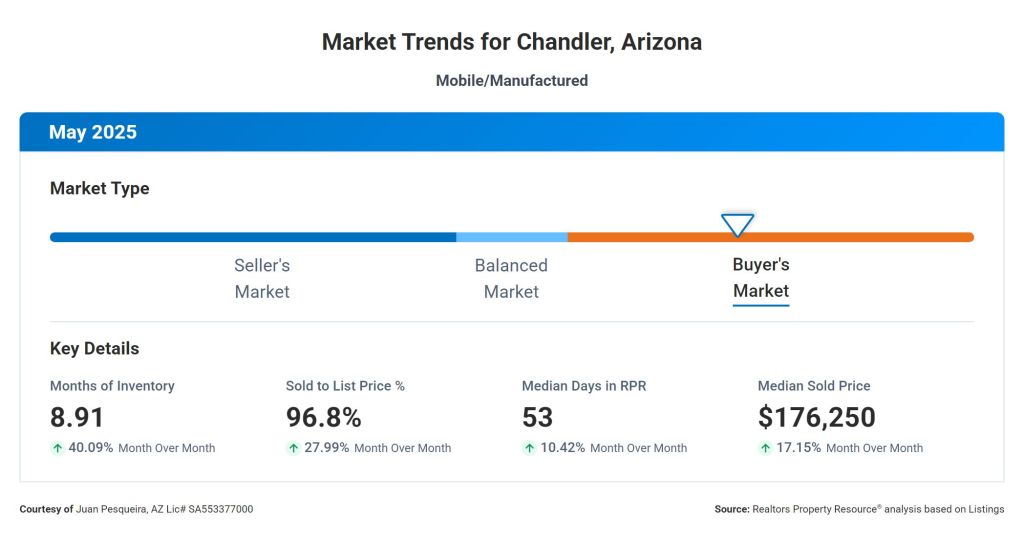
📍 Chandler, AZ
- Months Supply of Inventory: 8.91
- Median Days on Market: 53 days
- Sold-to-List Price Ratio: 97%
- Median Sold Price: $176,250
- 💰 Avg. Rent (all housing): $1,722/month realtor.comzillow.com
Summary: A competitive and balanced market. Homes are moving quickly and selling close to list price. Ideal for investors seeking quicker turnover and premium returns.
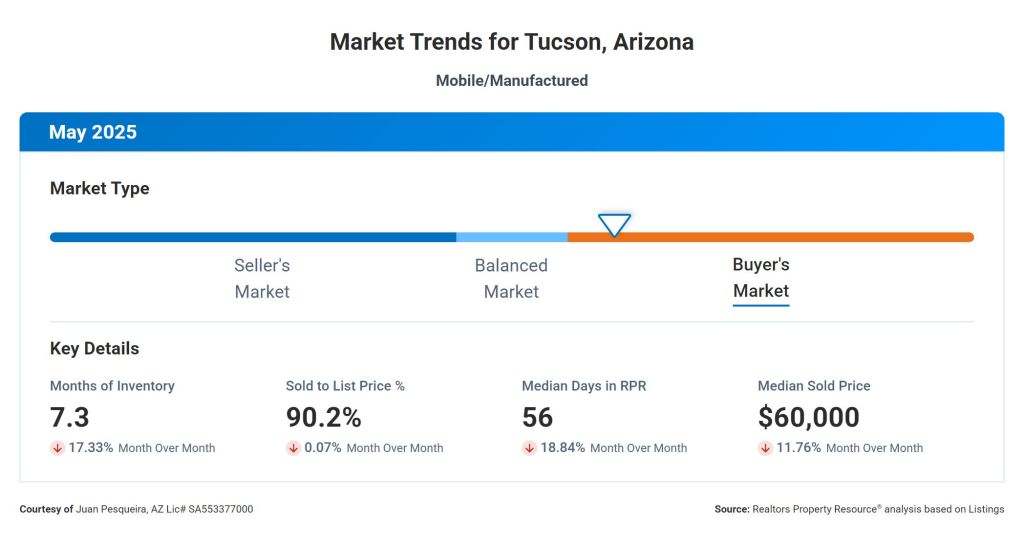
📍 Tucson, AZ
- Months Supply of Inventory: 7.3
- Median Days on Market: 56 days
- Sold-to-List Price Ratio: 90%
- Median Sold Price: $60,000
- 💰 Avg. Rent (all housing): $1,254/month
Investor insight: Lowest entry cost in the state. Stable demand, making Tucson a great candidate for high cap-rate investments.
Summary: Tucson remains one of the more affordable markets. Stable inventory and moderate pricing offer good entry points for buyers.
💸 Why Manufactured Homes Make Sense for Investors
For investors priced out of the single-family home market, manufactured homes offer lower acquisition costs, steady demand, and healthy rental returns. With prices ranging from $60K in Tucson to $176K in Chandler, you can enter the real estate market at a fraction of the cost.
Plus, these markets are showing balance—homes are not flying off the shelves, which gives investors time to evaluate opportunities, negotiate deals, and find solid cash-flowing properties.
📌 Pro Tip: Consider areas like Glendale or Mesa where homes take longer to sell. These slower markets often allow for better negotiations and value-add potential.
🚀 Final Thoughts
The Arizona manufactured home market is quietly thriving, and most agents aren’t talking about it. That’s changing here. As I continue to track trends and highlight opportunities, my goal is to become your go-to resource for all things manufactured/Mobile homes in Arizona.
Thinking of buying, selling, or investing?
Let’s talk — I can help you understand where the opportunities are and how to act on them.
Note: These numbers are meant to provide a general overview of the manufactured home market in Arizona. Keep in mind that rental rates and property values can vary depending on whether the home is land-leased, land-owned, or located in a 55+ retirement subdivision. While not exact, this data offers a solid foundation for understanding market trends and evaluating opportunities—especially for investors exploring more affordable entry points into Arizona real estate.


Leave a reply to Phx Area Manufactured/Mobile Home Market Trends Update – June 2025 – AriZona Real Estate insider! Cancel reply