
By Juan C Pesqueira, Arizona Real Estate Insider
As the rest of the country plays commercial real estate chess, Phoenix is out here flipping the board—again. The latest NAR Commercial Real Estate Market Insights Report (March 2025) just dropped, and once again, the Valley of the Sun is making big moves across nearly every major sector.
Let’s break it down, starting with what’s happening nationally—then zooming in on where Phoenix is quietly (or not so quietly) stealing the show.
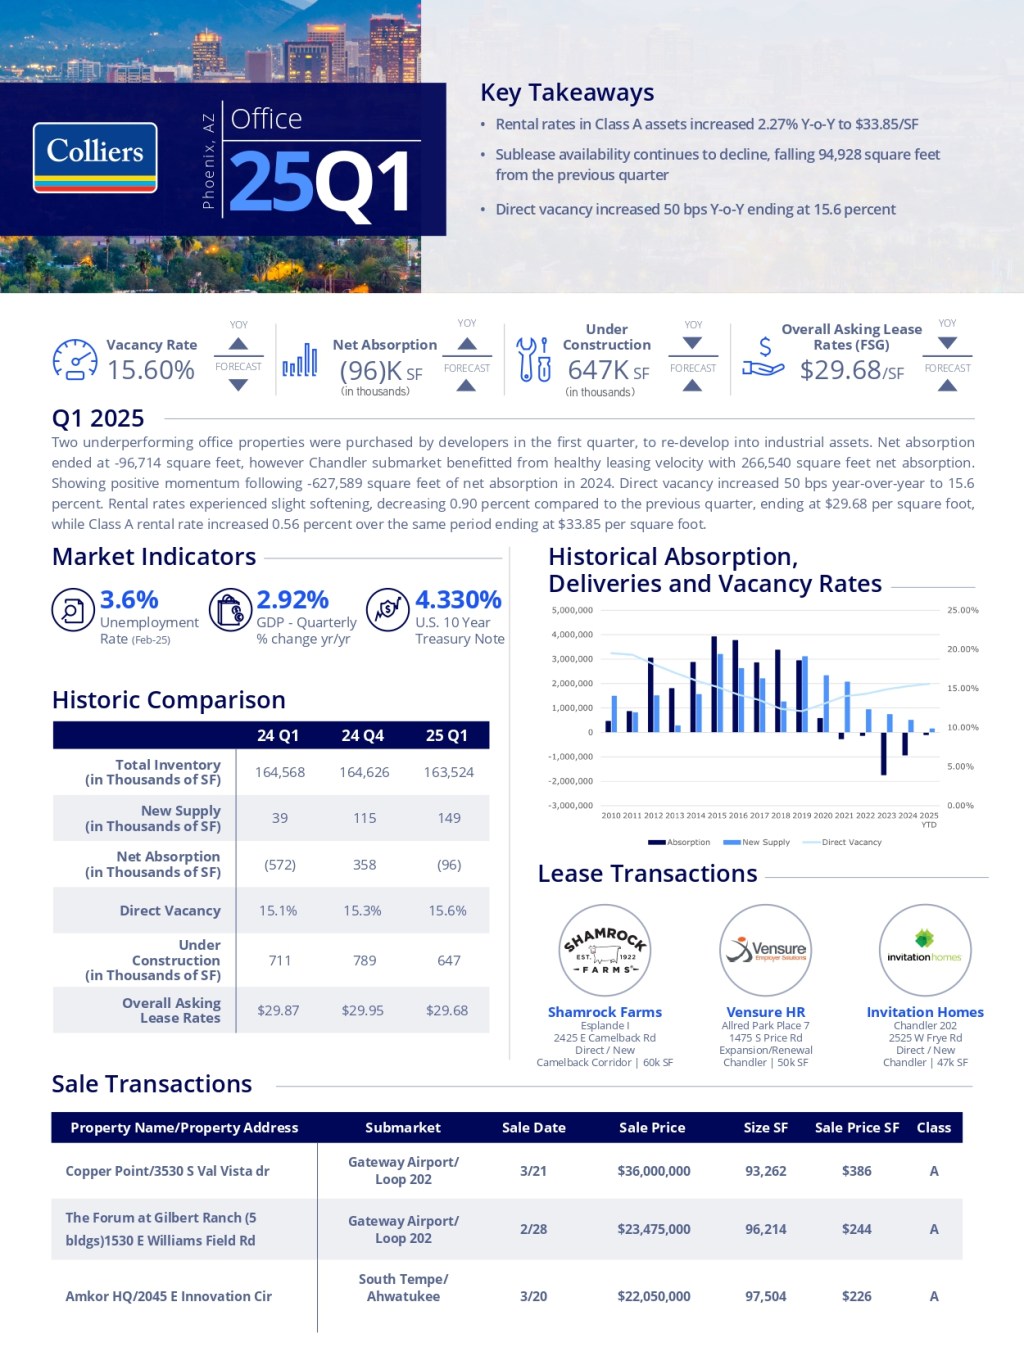
🏢 Office: Vacancy Climbing, but Opportunity Beckons
Across the U.S., the office sector is still adjusting to the work-from-home ripple effect. Vacancy rates have ticked up to 14.1%, with negative net absorption still the name of the game. But there’s a silver lining: office move-outs have slowed significantly, and some major markets—like New York—are actually bouncing back.
🔎 Phoenix Check-In:
Not all sunshine here. We’re listed in the Top 10 markets with the highest office vacancy rates, hitting 16.71% in Q1 2025, up from 16.09% a year ago.
Yes, that’s high—but this is where savvy investors can find diamonds in the rough. With developers hitting pause on new office builds, we’re entering a sweet spot for value-driven acquisitions and creative repositioning plays.
🏘️ Multifamily: Still Hot, but Cooling in Places
Nationally, multifamily continues to hold steady. Net absorption is up 46% YoY, while new construction is slowing down—a good combo for investors. Rents are inching upward (1.1%), and supply-demand dynamics are stabilizing.
🔎 Phoenix Check-In:
We’re flexing hard in this category. Phoenix made the Top 10 for strongest 12-month absorption, with 19,523 units absorbed in Q1 2025, up from 12,167 units in Q1 2024.
Despite oversupply worries in parts of the Sun Belt, our local market is proving it can digest inventory quickly, especially when product condition and location are on point.
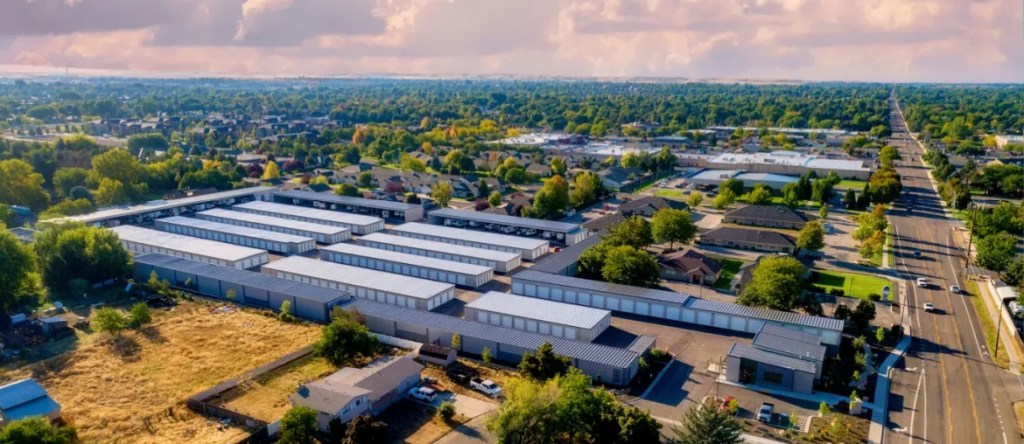
🏭 Industrial: The Powerhouse with Some Rust
While demand is still strong, net absorption nationally has slipped 42% YoY. Vacancy is rising slightly as new supply hits the market, but rents are still growing at a healthy clip—2.0% in early 2025.
🔎 Phoenix Check-In:
Our industrial engine is still roaring. Phoenix hit the Top 10 again with 17.25 million sq. ft. of net absorption, up from 11.66 million sq. ft. in Q1 2024.
With logistics demand still sky-high and development smartly tapering off, well-positioned assets (especially near transit corridors) are holding value—and then some.
🛍️ Retail: The Comeback Plateaus
- National Snapshot: Net absorption fell 77% YoY (just 10.5M sq. ft. this quarter). Vacancy ticked up slightly—its first rise in over two years. Rents grew 1.9%, driven mostly by general retail, which remains the healthiest subsector.
- Phoenix Insight:
While we didn’t rank in the top or bottom nationally, our retail landscape continues to evolve. Grocery-anchored centers, experiential concepts, and revived neighborhood strips are showing promise. Think local, think lifestyle.
🏨 Hospitality: Full Recovery in Sight
- National Snapshot: Occupancy is back to 63%, with ADR at $159 (21% above pre-pandemic levels). RevPAR has now officially exceeded pre-2020 benchmarks, signaling strength in leisure travel and select business markets.
- Phoenix Insight:
Not directly called out in the report, but local demand continues to benefit from major events, conferences, and our year-round weather advantage. Boutique hotels and extended stay products are ones to watch.
⚙️ Economic Drivers: Holding Steady
- Fed Policy: Interest rates held at 4.5% after three rate cuts in late 2024.
- Jobs: 151,000 added in February. Unemployment steady at 4.1%.
- GDP: Grew at a 2.4% annualized rate in Q4 2024—slower, but still positive.
- Inflation: Down to 2.8%—heading toward that sweet 2% target.
Final Thoughts:
While some metros are cooling off or facing market corrections, Phoenix continues to be a dynamic, resilient player in the national CRE landscape. The numbers don’t lie—we’ve got challenges (looking at you, office sector), but also serious momentum in multifamily and industrial.
Want to see the full NAR report? Click here to view it.


Leave a reply to The Phoenix Commercial Real Estate Market Is Moving—Just Not How You Think – AriZona Real Estate insider! Cancel reply