
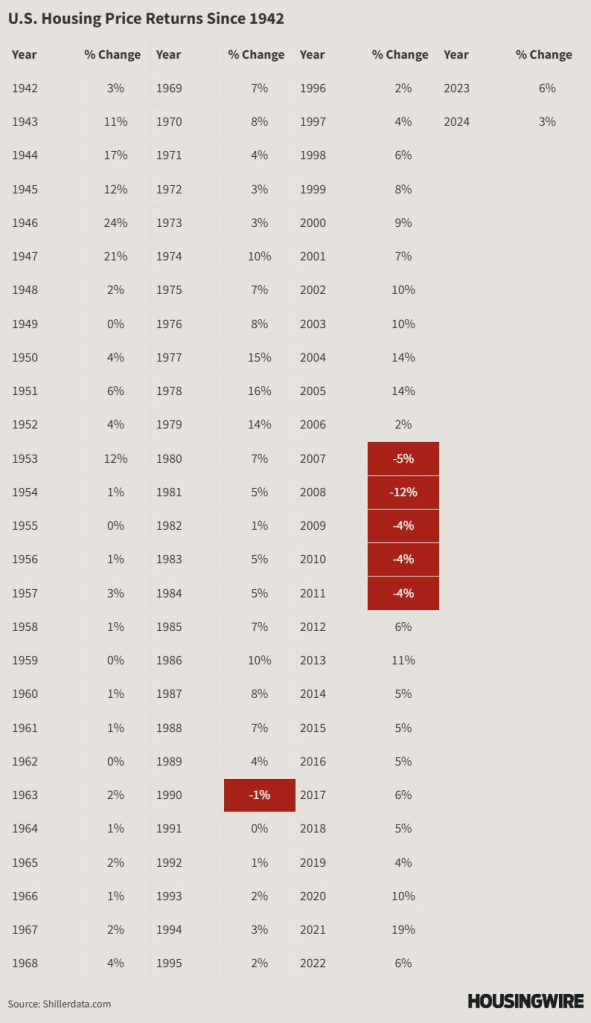
The housing market is a f**ken roller coaster ride—full of highs, lows, and unexpected twists. Looking at 82 years of U.S. housing price returns (courtesy of HousingWire), we can break down the trends into the good (booms 📈), the bad (slumps 😐), and the ugly (crashes 📉).
The Good: Booms & Growth 📈
Some years were golden for homeowners and investors, with double-digit gains and soaring home values.
- Post-WWII Boom (1940s-1950s): The economy surged, and the G.I. Bill fueled homeownership.
- 1946: +24% 📈 | 1947: +21% 📈
- Tech Boom & Economic Growth (1990s-2000s): Economic expansion pushed housing prices upward.
- 1999: +8% 📈 | 2000: +9% 📈
- Pandemic Housing Surge (2020-2021): Remote work, low interest rates, and demand for space sent prices skyrocketing.
- 2021: +19% 📈 (One of the biggest jumps in history!)
The Bad: Slowdowns & Corrections 😐
Not every year was a home run. Some periods saw slow growth or minor declines, often following big booms.
- High-Interest Rate Era (1980s): Inflation and steep mortgage rates slowed price growth.
- 1990: -1% 📉 (a rare drop in an otherwise stable market)
- Market Readjustments (2010s): The economy healed after the 2008 crash, but price growth remained moderate.
- 2012-2013: +6% 📈 to +11% 📈
The Ugly: Crashes & Recessions 📉
Some years were brutal, seeing steep declines that wiped out gains and left homeowners underwater.
- The Housing Crash (2007-2011): The biggest housing crisis in modern history.
- 2007: -5% 📉 | 2008: -12% 📉 | 2009-2011: -4% 📉 each year
These periods serve as stark reminders that what goes up can come down—hard.
Where Are We Today? (2024 Market Snapshot) 🤔
Right now, we’re in a tricky phase—a mix of high home prices, rising inventory, and uncertainty:
✅ High Home Prices: Prices remain elevated due to past demand surges. 📈
❌ High Interest Rates: Mortgage rates have climbed, making affordability tougher. 📉
📈 More Inventory: Homes are sitting longer, giving buyers more choices.
📉 Uncertainty: Will prices dip, or will demand keep them steady?
While we’re not in a crash, we could be heading toward a market correction as affordability tightens and buyers hesitate.
Conclusion: Lessons from History 📚
The U.S. housing market has always bounced back—but not without bumps along the way. Whether it’s the booms of the post-war years, the busts of the Great Recession, or today’s uncertainty, history teaches us that the market moves in cycles.
My recommendation to buyers is that patience may be beneficial. For sellers, implementing a strategic and accurate pricing strategy is essential. And if you’re watching from the sidelines—keep an eye on trends, because the next big shift might be just around the corner.
📉📈 What do you think? Are we heading for a slowdown or another boom? Let’s discuss!


Leave a comment